
A combination of natural processes and people's activities is causing the global landscape to change rapidly. In order to ensure the sustainable use of our natural resources, monitoring systems have become a necessity. Remote Sensing makes it possible for us to monitor large areas, for these abrupt (and sometimes, not so abrupt) changes in a cost-effective way.
Vegetation managers need accurate and timely information on the vegetation surrounding their power lines to minimize power outages and ensure public safety. Fall-ins are the number one cause of power failures.
Moving from Cycle-Based to Condition-Based Trimming
Historically, cycle-based tree trimming has been the “go-to” approach for vegetation managers, but this is labor-intensive, expensive, and does not always provide the best results as some locations become over trimmed, or not trimmed enough.
It is becoming increasingly common for vegetation managers to turn to different remote sensing techniques to detect vegetation that poses a risk to their power lines. There are a variety of different satellite sensors that can be utilized for remote sensing. Due to their effectiveness for vegetation classifications and cost-efficiency, Multispectral Scanners (MSS) and the utilization of satellite imagery, will be the focus of this article.
From Landsat to Sentinel and Beyond
The Landsat 1, initially named the Earth Resources Technology Satellite (ERTS), was launched on 23 July 1972 by the National Aeronautics and Space Administration (NASA). Mounted with a camera system named the Return Beam Vidicon (RBV) and a multispectral scanner, which recorded four spectral bands (green, red, and two infrared bands), it became the first satellite in space to produce the data necessary to complete Remote Sensing.
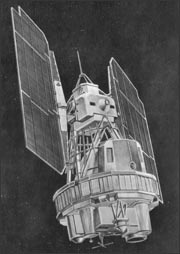
Landsat 1
“The ERTS spacecraft represent the first step in merging space and remote-sensing technologies into a system for inventorying and managing the Earth’s resources.”
- 1976 U.S. Geological Survey Director, Dr. V. E. McKelve
While the first Landsat launched in 1972, it was not until 2014 that the European Space Agency (ESA) launched Sentinel-1A as part of the Copernicus Programme.
The Sentinel-2 satellites (both A and B) contributed to the Copernicus Programme through their inclusion of multispectral instruments. Like the Landsat campaigns, Sentinel-2 satellite's primary objective is to provide satellite data for land cover/use monitoring, disaster monitoring, and climate change monitoring. Unlike the Landsat 8 satellite, the Sentinel-2A satellite has 13 bands, a higher spatial resolution (10 m), red-edge bands, and a temporal resolution of 5 days. Even though the Landsat 8 has only 11 bands, a temporal resolution of 16 days and comparatively poor spatial resolution (30m); though it does contain thermal bands. Sentinel-2’s higher spatial and temporal resolution tends to make it a better base for vegetation classification.
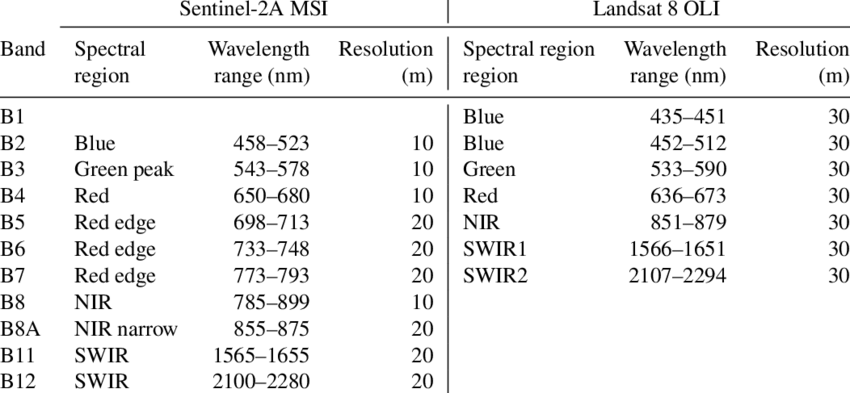
Sentinel Satellites capture wavelengths much more granular than Landsat
Electromagnetic Radiation Spectrum and Spectral Signatures
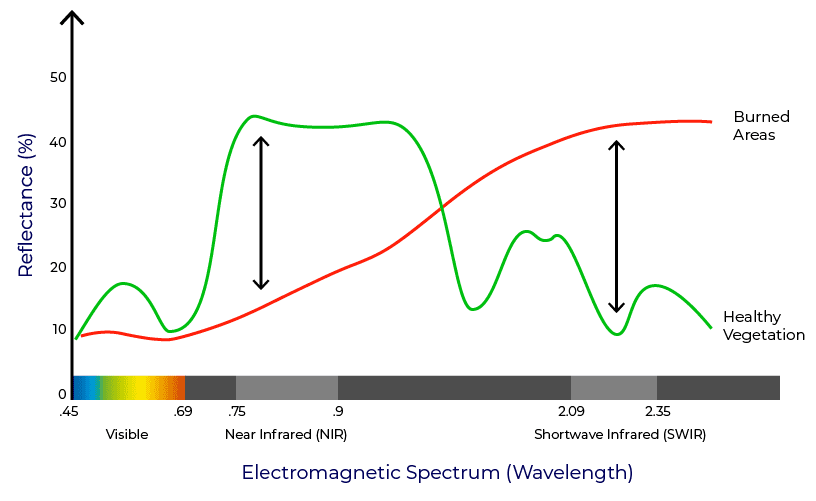
Objects on the earth can either reflect, transmit, or absorb the sun’s radiation (all of these different types of solar radiation are referred to as the electromagnetic radiation spectrum) in different ways. An object’s reflectance properties depend on a variety of factors, but the most important ones are: color, surface texture, and structure. These differences allow for an object’s identification through an analysis of their spectral signature (reflectance patterns).
These spectral signatures can be visualized as spectral reflectance curves via wavelengths. Vegetation’s spectral signature is a combination of low visibility in the Visible region (Red, Blue, Green) and high reflectance in the Near Infrared (NIR) region. Chlorophyll, along with other pigments, strongly absorb light in healthy vegetation along the red and blue wavelengths, while only lightly absorbing, and thus reflecting the green wavelengths. This is why healthy vegetation in summer tends to appear green to the naked eye.
Vegetation’s leaf structure strongly scatters NIR and reflects it at a greater rate than inorganic materials, making vegetation appear brighter in the NIR. This information is a foundation for “Red Edge” and the Normalized Difference Vegetation Index (NDVI).
Red Edge, NDVI, and Vegetation
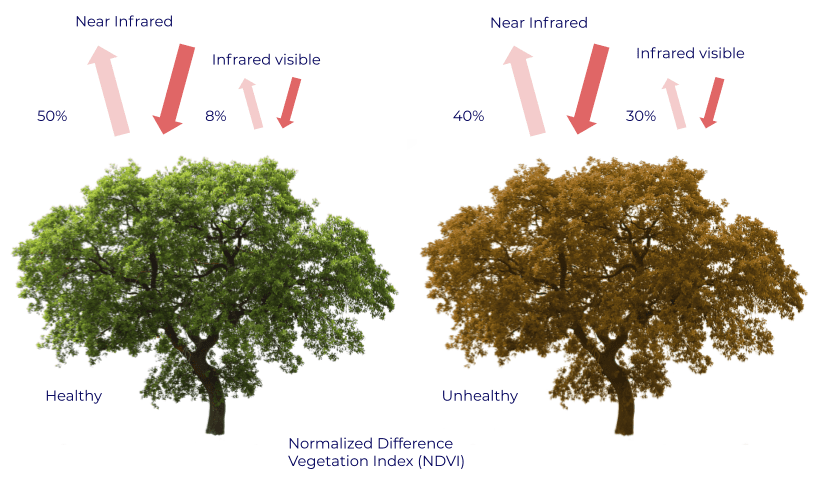
On the electromagnetic spectrum, right between where Chlorophyll is absorbed in the red range of the visible spectrum by vegetation and the vegetation leaf’s structure scatters the NIR wavelengths, sits the “Red Edge”. The Red Edge is one of the best descriptors for Chlorophyll content and is the basis of the Normalized Difference Vegetation Index (NDVI).
The NDVI is a highly regarded, well-known vegetation index that is used for a variety of different reasons, from drought monitoring to helping farmers navigate where to fertilize their crops. It leverages the reflectance value of the relationship between the red range of the visible spectrum and the NIR.
It is described in its formula:
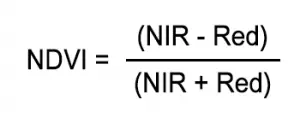
The result of the NDVI for a patch of vegetation will be between -1 and 1. A negative value typically indicates water, clouds, or snow while a value close to 0 indicates no vegetation (bare soil, etc). Values closer to 1 typically indicate a high density of vegetation in that area. (It’s important to note that when using NDVI to review vitality differences in vegetation to understand that the NDVI is dependent on the season; as vegetation changes throughout the year. It’s important to utilize the correct temporal spectral data in order to accurately distinguish between differences in vegetation’s seasonality.)
LiveEO and Vegetation Management
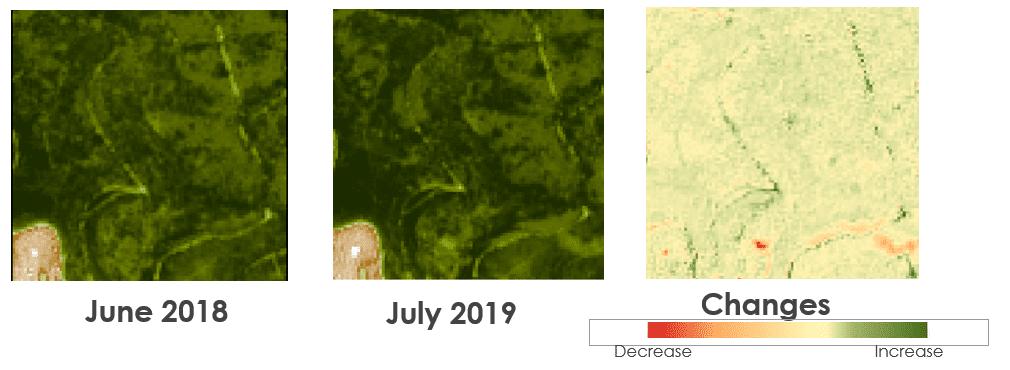
The NDVI is essential in helping to determine vegetation health and is one of the most trusted indicators of vegetation stress. In the context of how this can help grid operators, by understanding where vegetation is most stressed, operators can focus their attention on those areas, to minimize the danger of fall-ins and further minimize wildfires and additional damages to power lines.
LiveEO utilizes our direct APIs with major satellite providers and our advanced machine learning techniques, in combination with complex vegetation indices to create risk assessments for our customers of their Right-of-Ways (ROWs).
If training data from historic field measurements is available, LiveEO is capable of including this data into the training of our machine learning models to improve the assessment of the vegetation condition; producing even more accurate risk models. These risk models are then used to generate tasks in our Web and Mobile applications based on risk category, to show where immediate actions of vegetation clearance are necessary. By utilizing our risk models, clients like e.dis have improved the reliability of their system by 15% while reducing the cost of their identification process by 30% (Read our Case Study with E.dis).
Get in touch!


